IV.1. Measurements of basic parameters
A. Measurement of central obesity
- The BMI
(body weight in kg/height in meters squared) has been used for the diagnosis of the MetS since 1999.
B. Measurement of abdominal obesity
- The waist circumference and
- the waist-hip ratio are used.
- low HDL – cholesterol ratio (high-density cholesterol - high-density lipoprotein [HDL])
- and/or high triglyceride (TG) – FFA levels.
- The MetS is characterized by a high blood Glu level (hyperglycemia).
- Measurement of the amount of HbA1C
C. Measurement of blood fat levels (dyslipidemia)
D. Conditions in which blood Glu level is required
The HbA1C molecule is a marker of a permanently high blood Glu level. Its level indicates the blood Glu levels in the last 1 month.
- T2DM
- d. OGTT
- The MetS is characterized by high BP levels.
E. Measurement of blood pressure (BP)
F. Measurement of insulin resistance
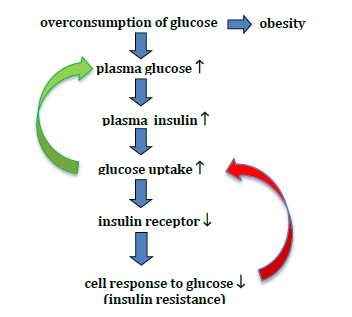
The insulin level is permanently high (hyperinsulinemia) in the MetS because of the permanently increased blood Glu level, which leads to a dysfunction of the insulin receptors. The resistance may be temporary or permanent. Insulin resistance may develop for other reasons, e.g. a genetic mutation or a defect in signal molecules.
The mechanism for the development of insulin resistance that recommended by the WHO (World Health Organization) and the EGIR (European Group for the Study of Insulin Resistance) since 1999 is outlined in Fig. 18.

Figure 18. The development of insulin resistance
a) Measurement of fasting plasma insulin/glucose ratio
This gives only approximate information, because it involves numerous errors (the insulin results are not exact: the products of cleavage are measured too, and the peripheral insulin level is measured).
b) QUICKI formula (quantitative insulin sensitivity check index measurement)
This is based on the fasting plasma Glu (FPG) and fasting plasma insulin (FPI) levels :
QUICKI = [1/(log FPI + log FPG)]
c) Measurement of fasting blood glucose and insulin (HOMA)
(HOMA: the homeostatic model assessment of insulin resistance.)
The insulin-independent Glu mobilization from the liver causes a fasting Glu level. Its main role is to ensure the energy supply to certain organs (the brain and the muscles).
(HOMA score = FPI × FPG / 22.5)
Where 22.5 is an empirical constant.
If the HOMA score >2.5, more insulin is needed by the body.
The correlation of HOMA with the insulin resistance is low (about 30%).
As insulin is not uniformly excreted and the liver may break it down in different ways, the C peptide level is measured for a more precise determination of the insulin level. The C peptide is produced in the same amount as insulin, but it is broken down in the kidneys. The level of the C peptide correlates well with the other components of the MetS.
d) Intravenous glucose and insulin test (frequent sampling i.v. glucose tolerance test – FSIVGTT)
- 1.5 h after a single i.v. dose of 300 mg/kg Glu, the blood Glu and insulin levels are measured (e.g. 30 blood samples during 3-4 hs).
- This test can not be performed in cases of T1DM and uncontrolled T2DM.
- Under medical supervision, it is not so widely applicable as the OGTT.
- It is better than the OGTT because it directly influences the B cells, and does not have gastrointestinal side-effects.
e) Continuous i.v. glucose assessment (CIGMA: continuous i.v. glucose model assessment)
- Glu is administered i.v. continuously at 180 mg/ml/min/body surface m2 and
- the 1- and 2-h blood samples are used for insulin and Glu measurements.
f) OGTT test
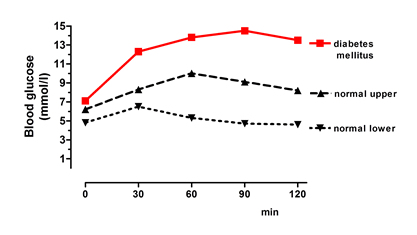
In the morning, the patients drink a 1 g/kg Glu solution after fasting (in clinical practice, dextrose is dissolved in 300 ml water). The normal fasting Glu level is 4.5-6.2 mmol/l; after Glu drinking the level ranges up to 10.0 mmol/l. The maximum level may be reached within 1 h (Fig. 19).
- This test can not be performed in cases of T1DM and uncontrolled T2DM.
- In healthy subjects, the maximum level is reached within 60 min, and the normal level is restored within 2 hs.

Figure 19. Changes in blood glucose level in the oral glucose tolerance test
g) Intravenous insulin tolerance test (ITT)
- A fasting sample is taken, 0.1-0.5 IU/kg insulin is administered i.v., and the blood Glu and insulin levels are checked every 5 min during 1.5 h. After the test, Glu is administered i.v.
- In the test, the decrease in the Glu level per min is important (K value).
- Medical supervision is needed, because of the occurrence of hypoglycemia.
h) Insulin suppression test (IST)
- Insulin, Glu and Som are continuously infused and
- the blood Glu and insulin levels are determined after 1.5 and 3 h.
- A higher blood Glu level in the last hour (steady-state plasma Glu: SSPG), indicates higher insulin resistance.
i) insulin-glucose clamp method (hyperinsulinemic-euglycemic clamp)
- A continuous insulin i.v. administration of about 100 mU/l maintains the insulin level (the body insulin production is blocked).
- 20% Glu is infused (Glu release from the liver is blocked) to maintain the blood Glu level in the normal range. The insulin sensitivity is characterized by the amount of Glu infused (M = Glu mg/min/kg).
- This is the most precise method, but it is the most expensive and the most difficult.